Visualize Uniform data in GA4
Analytics platforms are the source of truth for many organizations and contain audiences, traits, KPIs, and other meaningful business data. Passing metadata about your personalized or A/B testing content back into that source of truth enables your analytics team to understand how content is resonating and inform decisions on whether targets for that type of content are being met, whether adjustments should be made to improve the content, or if further treatments to be added for under-performing segments.
What data is passed from Uniform Context?#
The integration with Google Analytics 4 enables you to see the performance data associated with experiences you created in Uniform Context.
This is done by passing an Events payload via a Google Analytics Custom Event.
Personalization#
The following code demonstrates how Uniform sends custom event data to GA4 to capture personalization activity:
A/B testing#
The following code demonstrates how Uniform sends custom event data to GA4 to capture A/B testing activity:
Validating the integration#
To test that the integration is working, use the GA Tag Debugger chrome extension. This will enable you to check that the integration is firing as expected. The debugger will push events into the browser's JavaScript console for inspection.
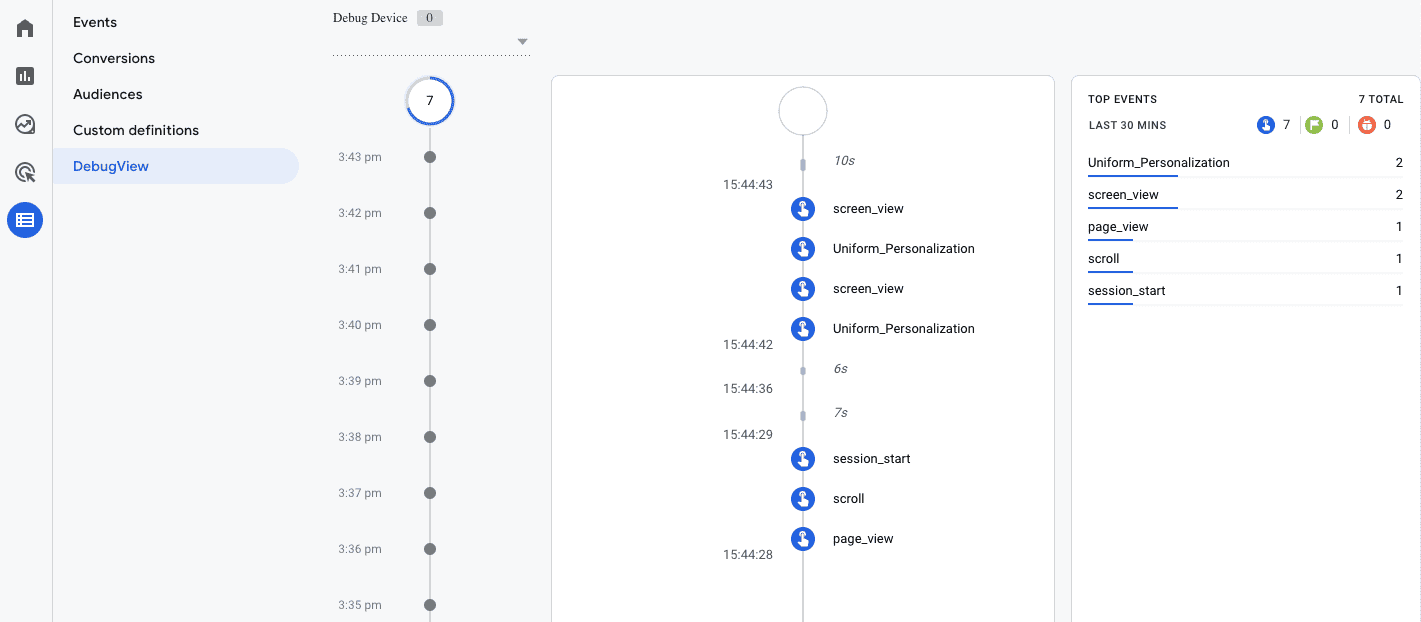
Within your Google Analytics 4 property, there is also a "debug view" that allows you to see a real-time feed of events as they come into your property. The debug view can be reached from the main menu by navigating to Configure > DebugView.
Creating dimensions and audiences#
A custom dimension in Google Analytics provides the ability to slice metrics data where the data is scoped appropriately.
An audience is a group of users that have any combination of similar attributes or traits. By grouping them together, we can understand patterns of behaviors.
warning
In the examples below, we're referring to "Uniform Personalization." The process is identical for your experiments; only you would use the Event Name: "Uniform AB Testing" instead.
Create a custom dimension#
Navigate to Configure > Custom definitions.
Click Create custom dimensions.
Enter the following values:
Field Value Notes Dimension name Uniform PersonalizationYou can use any value you want here, but we recommend using the same name as the custom event. Scope Event Description Represents personalization activity captured by the Uniform tracker. This is an optional value that can be helpful to other people in your organization who use Google Analytics. Event parameter variantIdsThis will enable you to filter and view each different treatment you have assigned for a specific piece of personalized content. 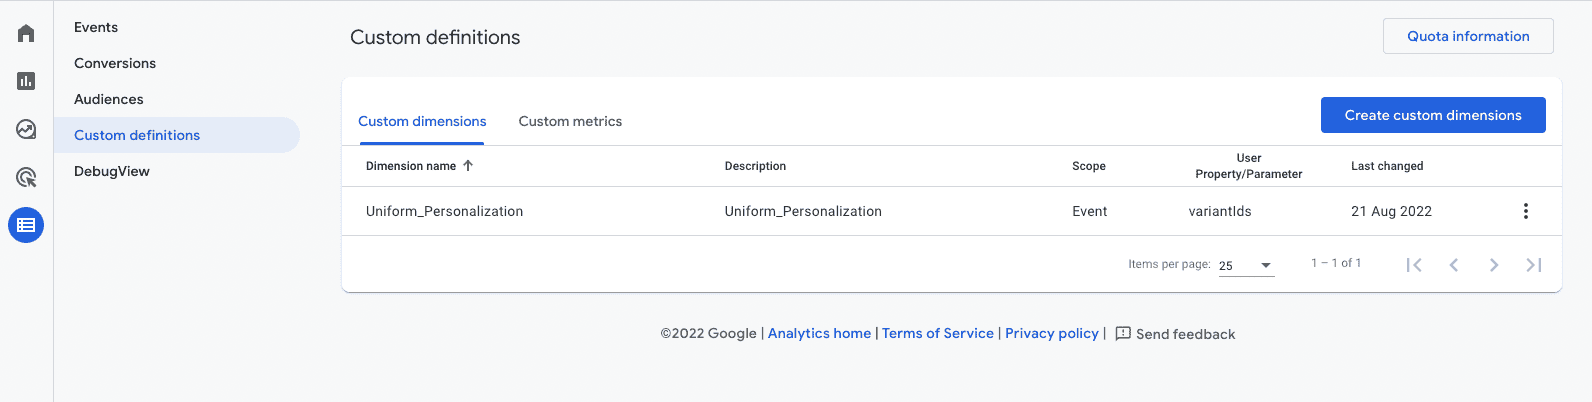
Click Save.
info
This custom dimension can now be applied to your standard and free-form reports as either a dimension, comparison, or filter.
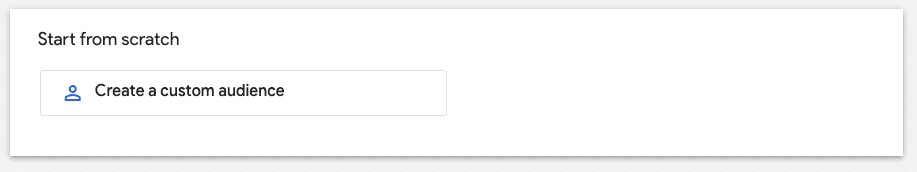
Create an audience#
Navigate to Configure > Audiences.
Click New audience.
Click Create a custom audience.
Enter a clear name and description.
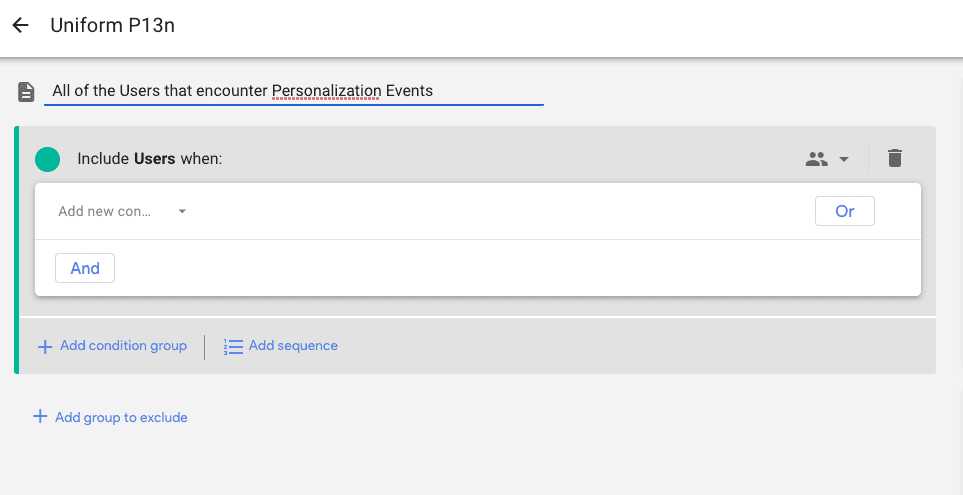
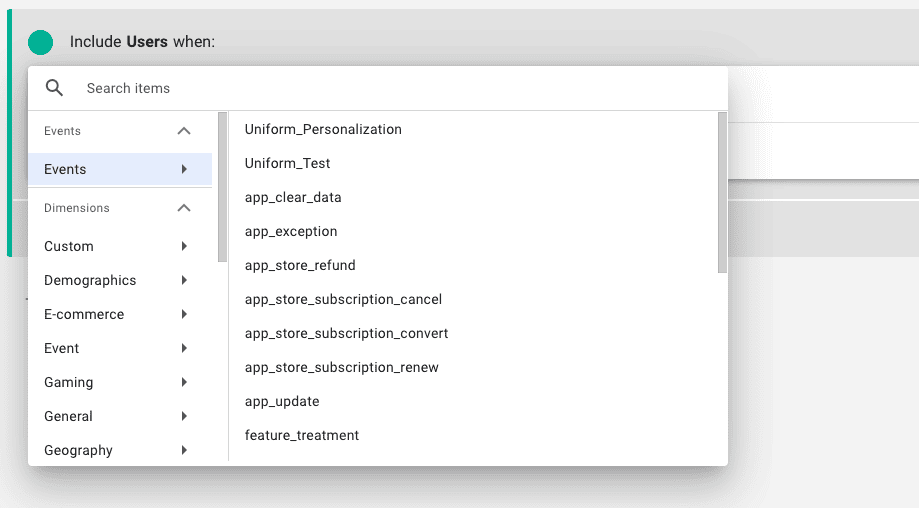
Select Add new condition and under "Events" look for and select the Uniform Event Name (typically: "Uniform Personalization").
info
An event must have been collected by Google Analytics in order for it to appear in this interface. In addition, data in GA4 can take 24-48 hours to process and appear in the reports UI.
Click Add a Parameter > Custom > Uniform Personalization.
Set the following values:
Field Value Condition doesn't contain Value (not set)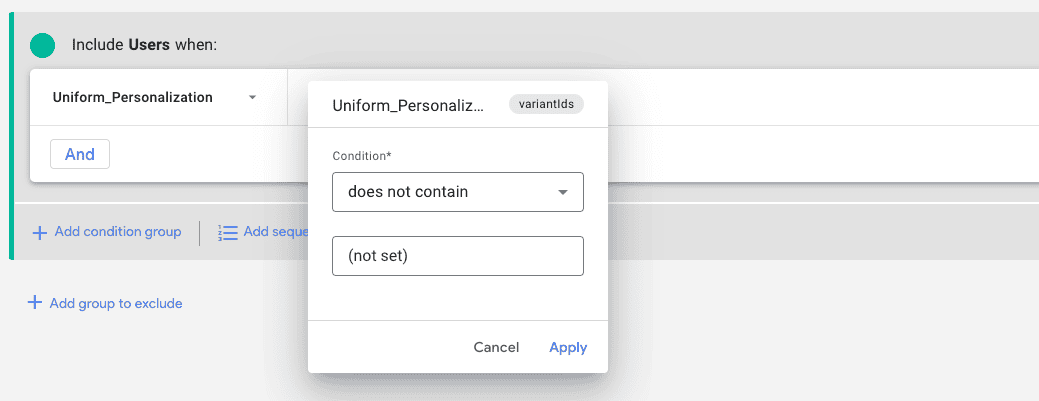
Click Apply.
info
Now you have your audience.
Creating reports#
Custom dimensions and Audiences can be used in similar ways across Google Analytics, such as comparison segments, dimensions, or filters for standard, out-of-the-box reporting or Google Analytics 4 exploration reporting.
Standard reports#
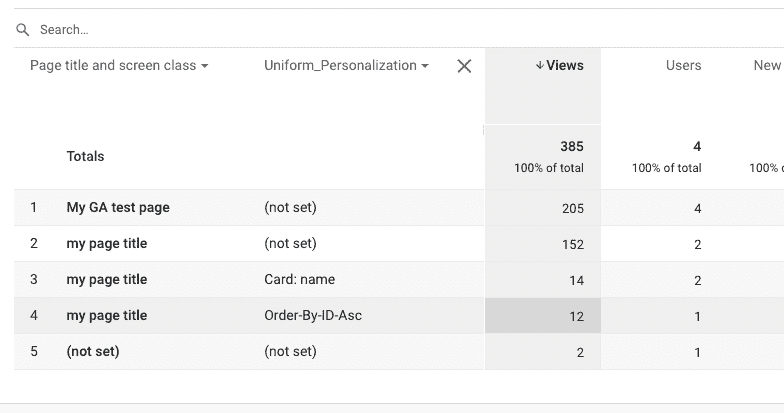
You can use standard reports to determine the engagement rate for your personalization variations.
Navigate to Reports > Life cycle > Engagement > Pages and screens.
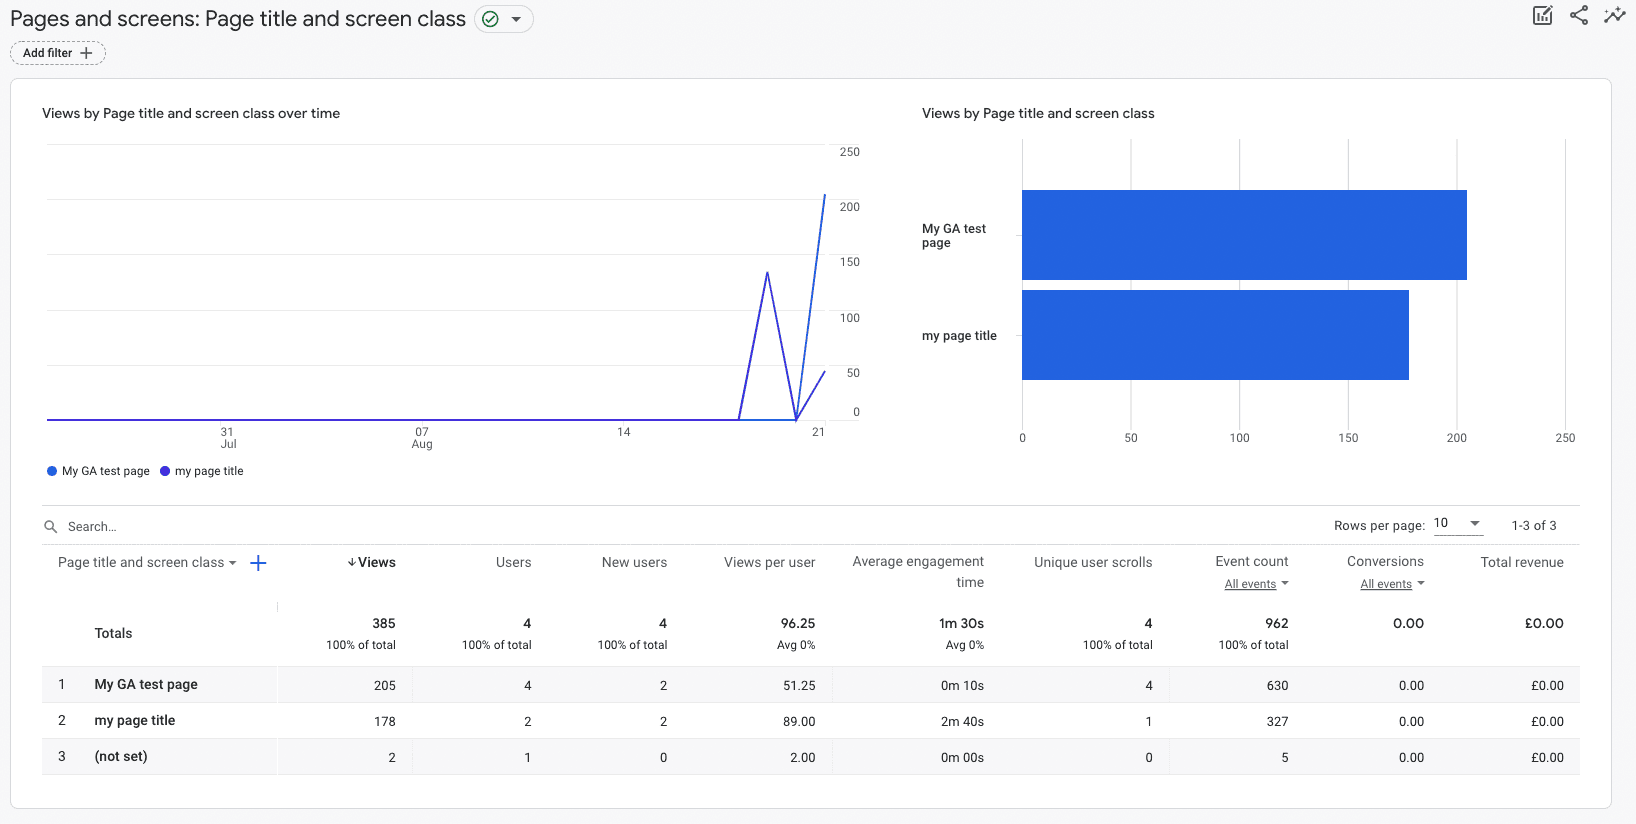
At the bottom part of the screen, under the "Search..." box, click the sign.
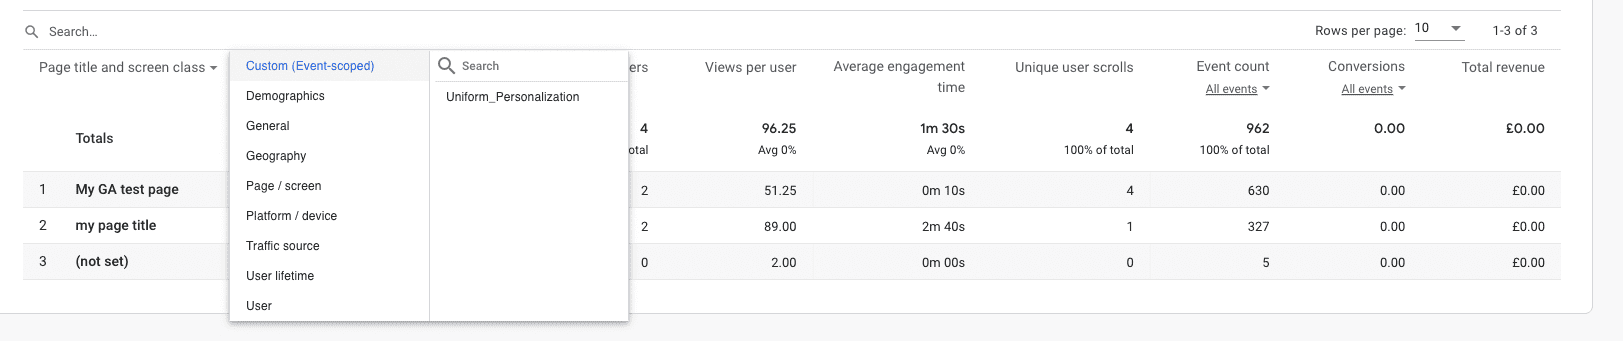
Select your custom dimension.
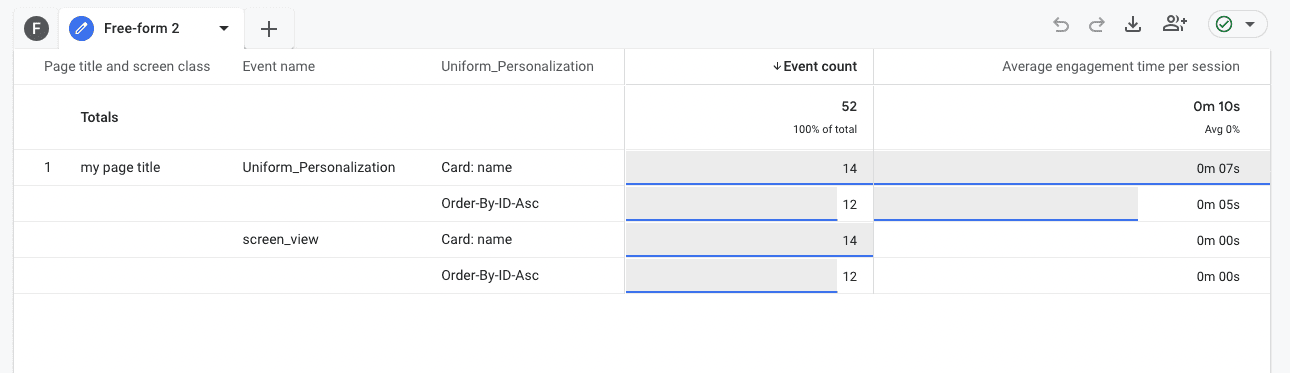
Exploration reports#
The free-form workbench provides a great deal of flexibility to enable you to look at your information from different points of view, making it easier to spot patterns within your data.
Navigate to Explore.
Click Free-form.
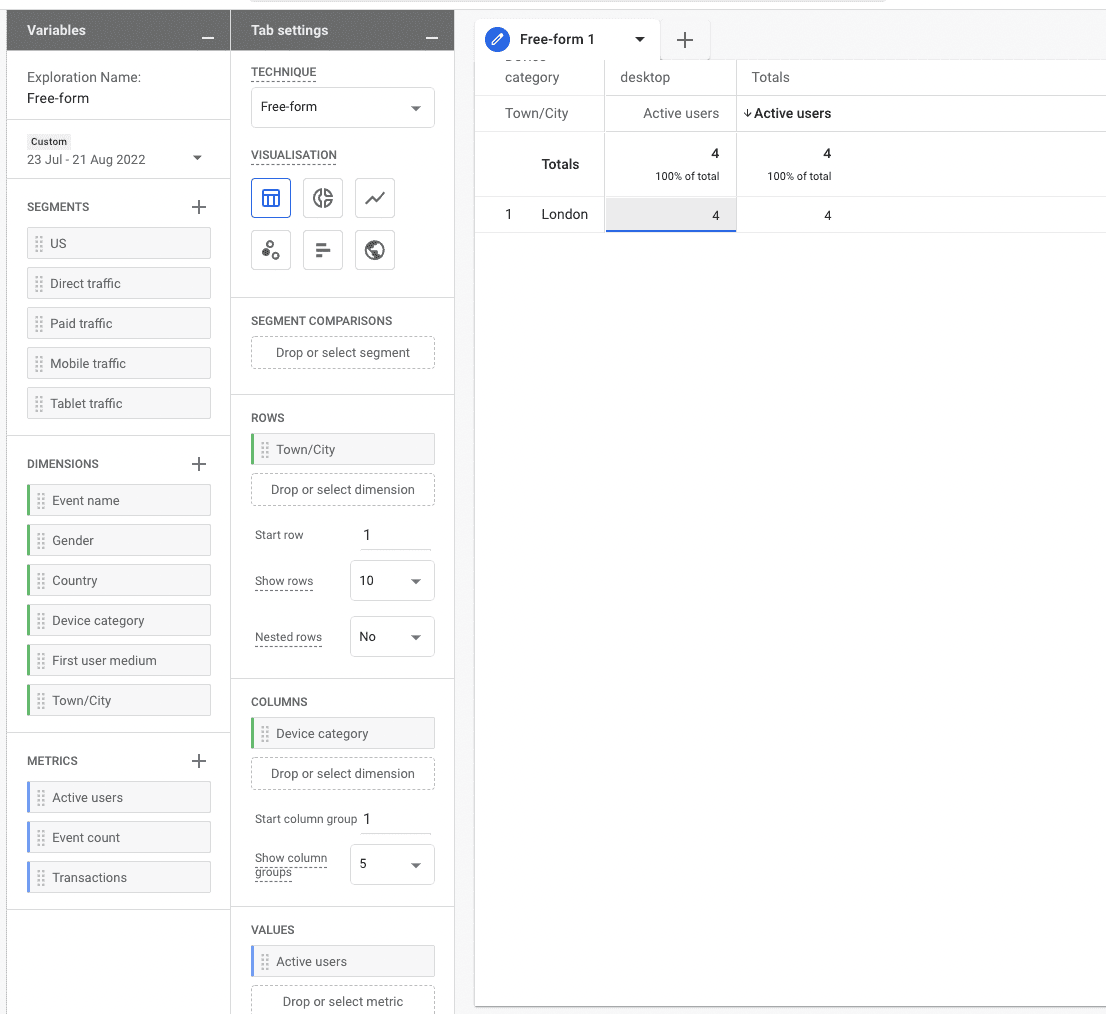
Import the If you want to see the average engagement rate for the personalization treatments, you need to import the following variables:
Type Value Dimension Uniform Personalization Metric Average engagement time per session info
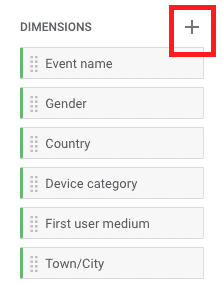
Import the dimension or metric by using the in the respective section.
Now add the data to the report by dragging it directly onto the body of the report or selecting it from the "Tab settings."
info
The tab settings option provides greater control of the design of the report and the order of your dimensions and metrics.