How to use Uniform Insights
How does it work?#
This is capabiltity that can be enabled by installing a special integration from Uniform. After it is configured, each Personalization and A/B Test inside Uniform's visual composition editor will get a new Insights tab showing primary (conversion-focused) and secondary metrics with the breakdown by variation:
This integration requires a one-time addition of a special Insights plugin for the Uniform Context tracker and can co-exist with your existing analytics systems of choice.
See the how to install guide for the detailed steps.
Features#
The goal of Uniform Insights is to help marketers and growth specialists understand how their experiements and personalization is performing in context of where content and experiences are managed, discover new optimization opportunities and understand the behavior of visitors in real-time.
Performance metrics#
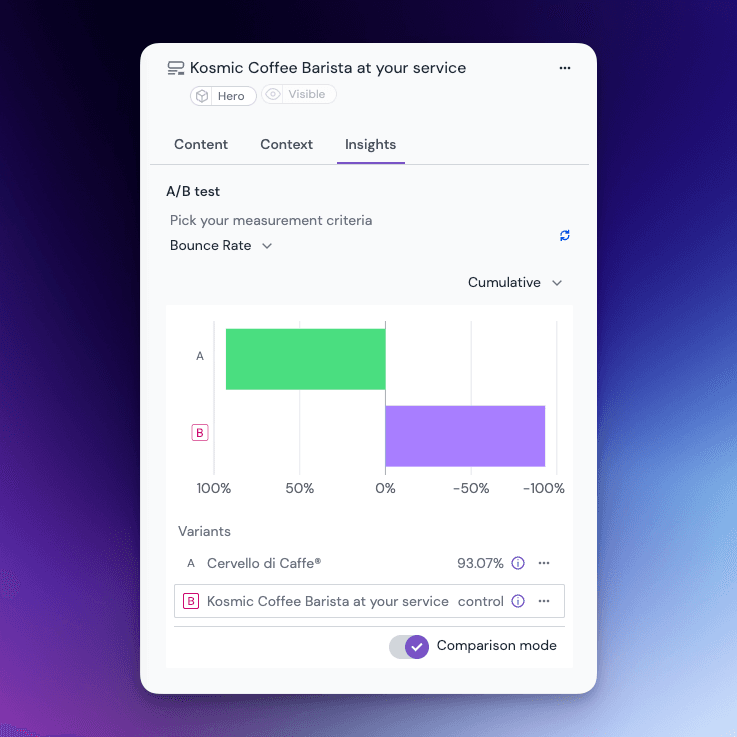
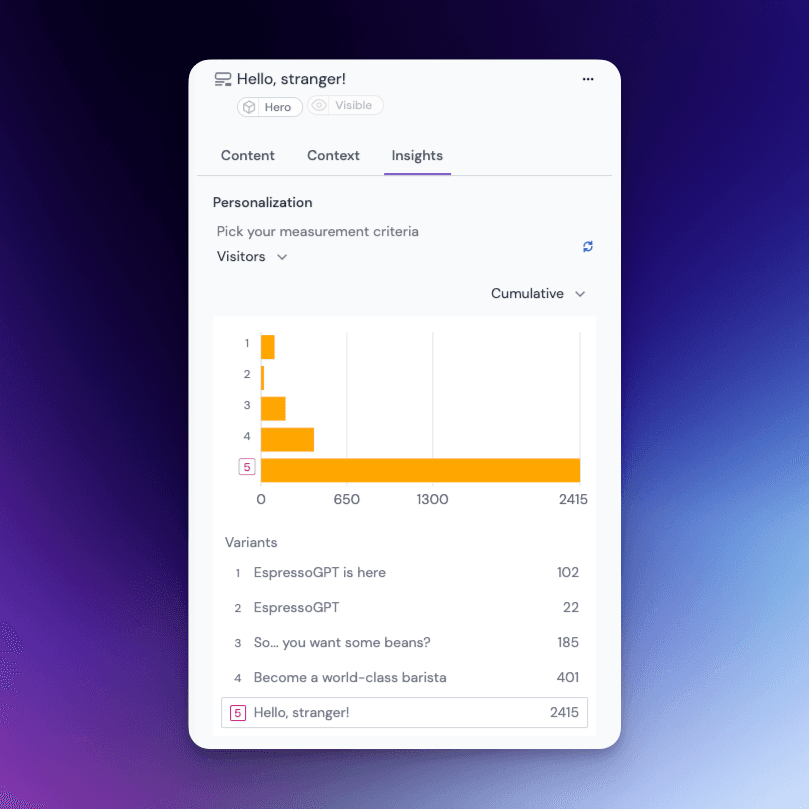
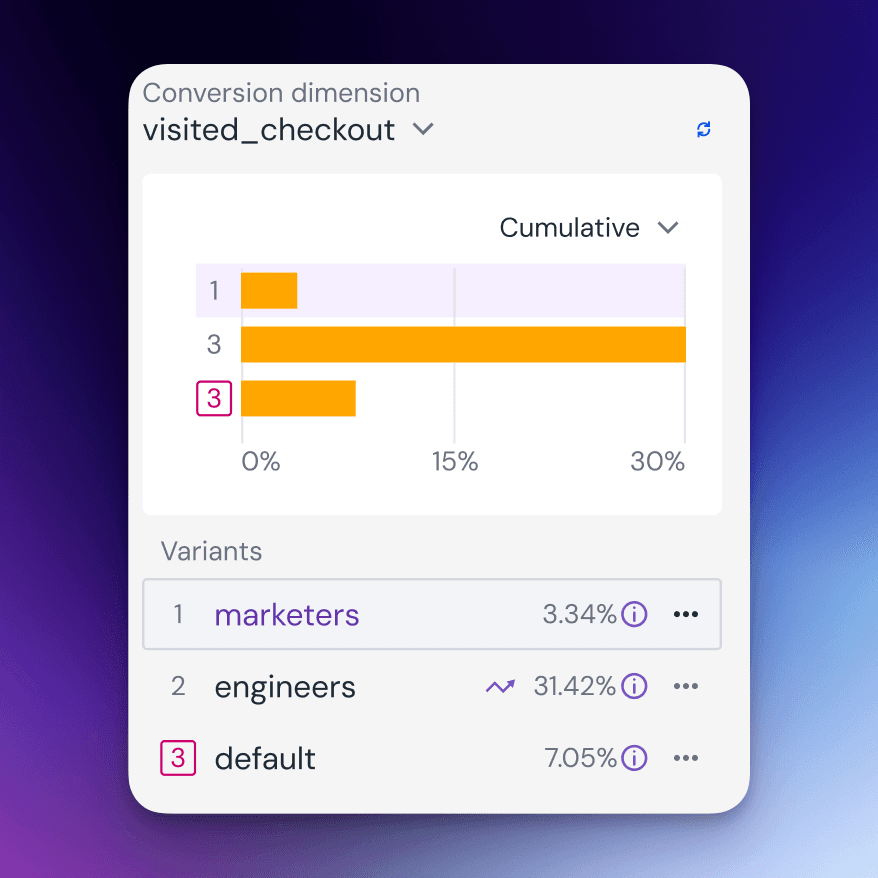
For each A/B test or personalization, you can see how each variation is performing using primary and secondary metrics.
Primary metrics#
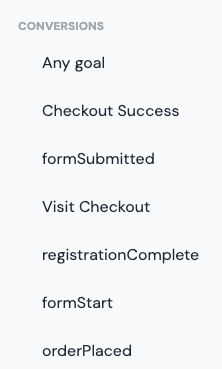
Any Uniform signal configured to trigger conversion will be used to measure conversion rate. This is a solution-specific configuration, varying by your use case. In addition, you are able to measure conversion across all signals, that are marked as conversion.
Secondary metrics#
Secondary metrics supplement the primary metrics to provide a more comprehensive view of the test performance. The following secondary metrics are available:
- Visitors: number of unique visitors reached
- Visits: number of visits
- Events: number of events triggered
- Bounce rate: percentage of visitors who leave the site after viewing only one page
Trending variation#
Based on real-time data collection, Uniform Insights can detect the trending variation in the test. This is a variation that is outperforming the others in real-time. This will help you in early detection of a winner and focus on optimizing this variation.
Statistical significance calculation#
Uniform Insights uses collected data and industry accepted methods of statistical significance calcucation to detect a winning variation and highlight it inside the Insights tab:
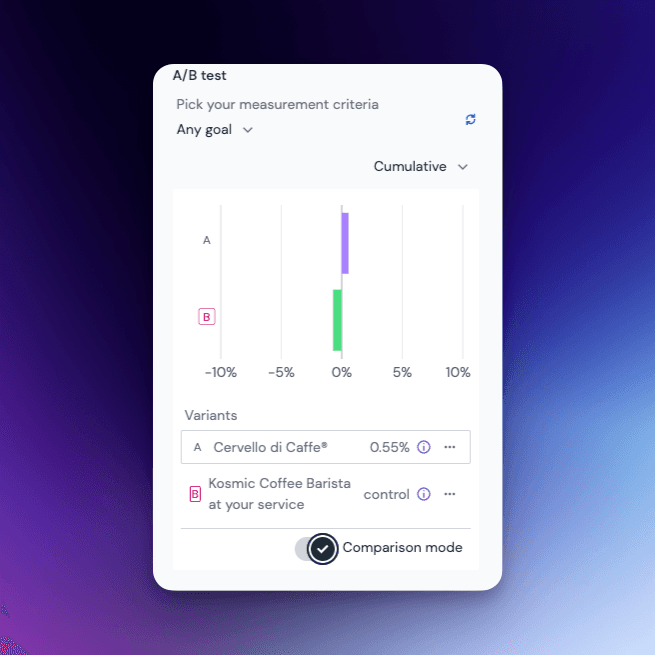
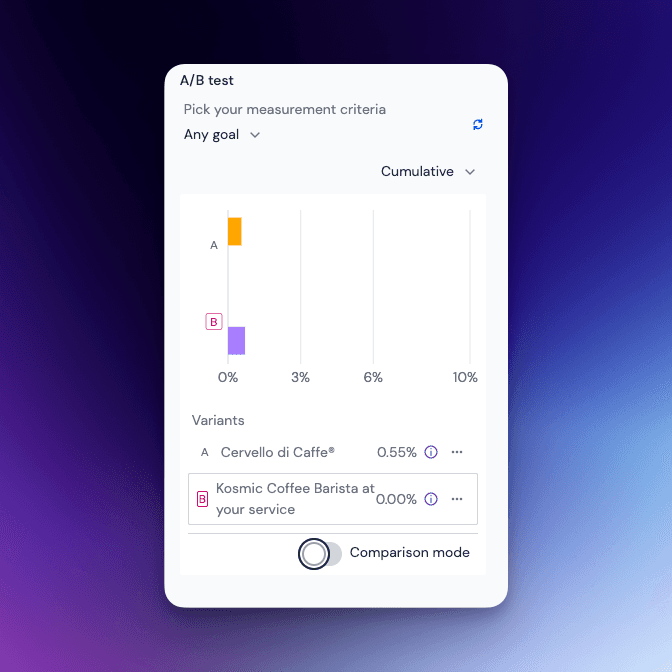
Comparison mode#
For both A/B testing and personalization, you can switch to the Comparison mode to see how the performance of the current variation compares to the control variation in case of an A/B test and to the baseline personalization variation if you analyze personalization performance.
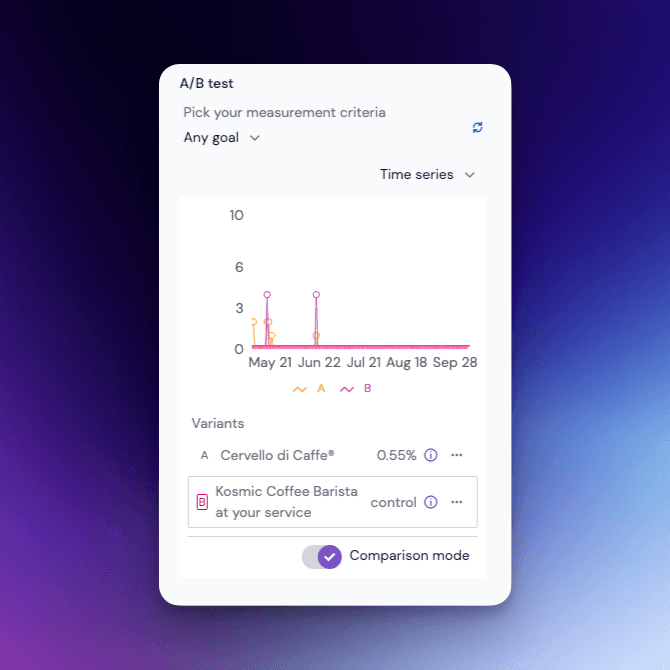
Cumulative and time series views#
Time series view shows historic performance of all variations of a test or personalization in a line chart:
Measuring conversion#
Conversion measurement is performed via a Uniform signal that is configured to trigger conversion. It's a new setting enabled with Insights and accessible in the signal editor:
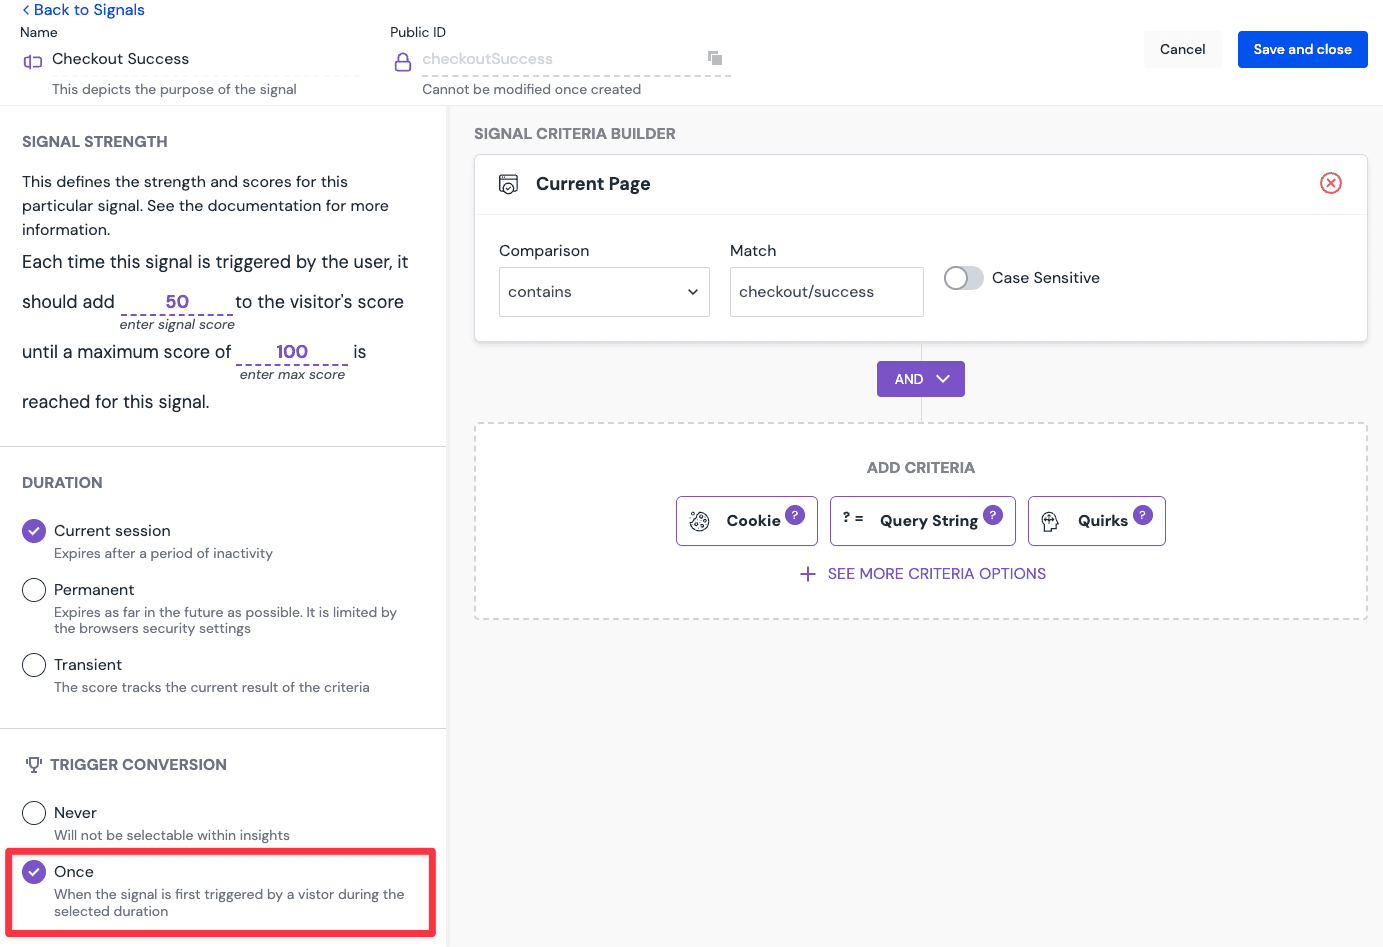
Simply toggle Once in the Trigger Conversion section of the signal editor to enable conversion measurement.
note
Make sure to save and publish the manifest after applying this change. This may require a rebuild of your application depending on your setup.
You can either use an existing signal and configure it to trigger conversion or create a new signal.